Medical Cameras Market by Camera Type , Resolution , End-Users Global Forecast to 2026
Medical Cameras Market by Camera Type (Endoscopy Cameras, Ophthalmology Cameras, Dermatology Cameras), Resolution (HD Cameras, SD Cameras), Sensor (CMOS, CCD), End-Users (Hospitals & Ambulatory Surgery Centers, Specialty Clinics)-Global Forecast to 2026
The medical cameras market is projected to reach USD 4.1 billion by 2026 from USD 2.9 billion in 2021, at a CAGR of 7.3% during the forecast period. Market growth is largely driven by the increasing number of surgical procedures, growing demand for endoscopic procedures, technological advancements, and increasing investments in endoscopy and laparoscopy facilities. However, the high cost of medical cameras is a major restraint for market growth. Product discontinuations, a shortage of trained medical professionals, and the availability of refurbished products are also major challenges limiting market growth to a certain extent.

The medical cameras market is projected to reach USD 4.1 billion by 2026 from USD 2.9 billion in 2021, at a CAGR of 7.3% during the forecast period. Market growth is largely driven by the increasing number of surgical procedures, growing demand for endoscopic procedures, technological advancements, and increasing investments in endoscopy and laparoscopy facilities. However, the high cost of medical cameras is a major restraint for market growth. Product discontinuations, a shortage of trained medical professionals, and the availability of refurbished products are also major challenges limiting market growth to a certain extent.
"The surgical microscopy cameras segment accounted for the highest growth rate in the medical cameras market, by type, during the forecast period"
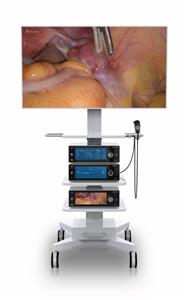
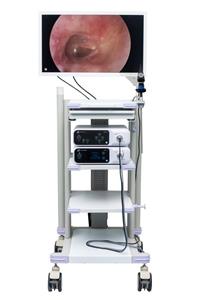
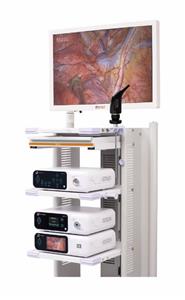
Based on type, the medical cameras market is segmented into surgical microscopy cameras, endoscopy cameras, dermatology cameras, ophthalmology cameras, dental cameras, and other medical cameras. The surgical microscopy cameras segment accounted for the highest growth rate in the medical cameras market in 2020. This can be attributed to the increasing number of surgical procedures and the introduction of technologically advanced products.
"CMOS Sensor segment accounted for the highest CAGR"
Based on sensor, the medical cameras market is segmented into CMOS Sensor and CCD Sensor. In 2020, CMOS sensors accounted for the highest growth rate. The major factors driving the growth of this is the observable shift in the preference for CMOS sensors over CCD sensors due to its various advantages over CCD sensors.
"High-definition (HD) cameras segment accounted for the highest CAGR"
Based on resolution, the medical cameras market is segmented into standard-definition (SD) cameras and high-definition (HD) cameras. High-definition (HD) cameras registered highest growth rate during the forecast period. This can be attributed to introduction of technologically advanced products in this segment by players in medical cameras market.
"Hospitals & ambulatory surgery centers segment accounted for the highest CAGR"
Based on end users, the global medical cameras market is segmented into hospitals & ambulatory surgery centers and specialty clinics. In 2020, the hospitals & ambulatory surgery centers segment accounted for the highest growth rate. This can be attributed to the rising number of hospitals coupled with large patient pool for target diseases, and increasing healthcare expenditure.
"Asia Pacific: The fastest-growing region in the Medical cameras market"
The medical cameras market is segmented into North America, Europe, Asia Pacific, and Rest of the World. Asia Pacific is projected to register the highest CAGR during the forecast period. This can primarily be attributed to the growing patient population and increasing healthcare expenditure in emerging Asian countries.
The primary interviews conducted for this report can be categorized as follows:
By Company Type: Tier 1 - 42%, Tier 2 - 28%, and Tier 3 - 30%
By Designation: C-level - 30%, D-level - 34%, and Others - 36%
By Region: North America- 46%, Europe- 25%, Asia Pacific - 18%, RoW - 11%
Lists of Companies Profiled in the Report:
Olympus Corporation (Japan)
Richard Wolf GmbH (Germany)
TOPCON CORPORATION (Japan)
Sony Corporation (Japan)
Stryker (US)
Danaher (US)
Canon Inc. (Japan)
Carl Zeiss AG (Germany)
Smith & Nephew (UK)
Carestream Dental LLC. (US)
Basler AG (Germany)
ATMOS MedizinTechnik GmbH & Co. KG. (Germany)
IMPERX, Inc (US)
IDS Imaging Development Systems GmbH (Germany)
Optomed Plc (Finland)
HAAG-STREIT GROUP (Switzerland)
CYMO B.V. (Netherland)
Diaspective Vision GmbH (Germany)
Dage-MTI (US)
Fude Technology Group Limited (China)
Healthtech Engineers Private Limited (India)
SCHOLLY FIBEROPTIC GMBH (Germany)
Medicam (India)
ESC Medicams (India)
Tonglu Kanger Medical Instrument Co., Ltd (China).
Research Coverage:
This report provides a detailed picture of the medical cameras market. It aims at estimating the size and future growth potential of the market across different segments, such as type, sensor, resolution, end user, and region. The report also includes an in-depth competitive analysis of the key market players, along with their company profiles, recent developments, and key market strategies.
Key Benefits of Buying the Report:
The report will help market leaders/new entrants by providing them with the closest approximations of the revenue numbers for the overall medical cameras market and its subsegments. It will also help stakeholders better understand the competitive landscape and gain more insights to better position their business and make suitable go-to-market strategies. This report will enable stakeholders to understand the market's pulse and provide them with information on the key market drivers, opportunities, and challenges.
TABLE OF CONTENTS
1 INTRODUCTION
1.1 OBJECTIVES OF THE STUDY
1.2 MARKET DEFINITION
1.2.1 INCLUSIONS & EXCLUSIONS
1.3 MARKET SCOPE
1.3.1 MARKET COVERED
FIGURE 1 GLOBAL MEDICAL CAMERAS MARKET SEGMENTATION
1.3.2 YEARS CONSIDERED FOR THE STUDY
1.4 CURRENCY
1.5 LIMITATIONS
1.6 STAKEHOLDERS
1.7 SUMMARY OF CHANGES
2 RESEARCH METHODOLOGY
2.1 RESEARCH DATA
2.1.2.1 Key data from primary sources
2.1.2.2 Key industry insights
2.1.1.1 Key data from secondary sources
FIGURE 2 RESEARCH DESIGN
2.1.1 SECONDARY DATA
2.1.2 PRIMARY DATA
FIGURE 3 PRIMARY SOURCES
FIGURE 4 BREAKDOWN OF PRIMARY INTERVIEWS: BY COMPANY TYPE, DESIGNATION, AND REGION
2.2 MARKET SIZE ESTIMATION
FIGURE 5 BOTTOM-UP APPROACH
FIGURE 6 CAGR PROJECTIONS: SUPPLY-SIDE ANALYSIS
FIGURE 7 TOP-DOWN APPROACH
2.3 MARKET BREAKDOWN AND DATA TRIANGULATION
FIGURE 8 DATA TRIANGULATION METHODOLOGY
2.4 MARKET SHARE ANALYSIS
2.5 ASSUMPTIONS FOR THE STUDY
2.6 COVID-19 ECONOMIC ASSESSMENT
2.7 ASSESSMENT OF THE IMPACT OF COVID-19 ON THE ECONOMIC SCENARIO
FIGURE 9 CRITERIA IMPACTING THE GLOBAL ECONOMY
FIGURE 10 RECOVERY SCENARIO OF THE GLOBAL ECONOMY
3 EXECUTIVE SUMMARY
FIGURE 11 MEDICAL CAMERAS MARKET, BY TYPE, 2021 VS. 2026 (USD MILLION)
FIGURE 12 MEDICAL CAMERAS MARKET, BY SENSOR, 2021 VS. 2026 (USD MILLION)
FIGURE 13 MEDICAL CAMERAS MARKET, BY RESOLUTION, 2021 VS. 2026 (USD MILLION)
FIGURE 14 MEDICAL CAMERAS MARKET, BY END USER, 2021 VS. 2026 (USD MILLION)
FIGURE 15 GEOGRAPHIC SNAPSHOT OF THE MEDICAL CAMERAS MARKET
4 PREMIUM INSIGHTS
4.1 MEDICAL CAMERAS MARKET OVERVIEW
FIGURE 16 INCREASING NUMBER OF SURGICAL PROCEDURES TO DRIVE MARKET GROWTH
4.2 ASIA PACIFIC: MEDICAL CAMERAS MARKET, BY END USER & COUNTRY (2020)
FIGURE 17 HOSPITALS & AMBULATORY SURGERY CENTERS ACCOUNTED FOR THE LARGEST SHARE OF THE APAC MEDICAL CAMERAS MARKET IN 2020
4.3 MEDICAL CAMERAS MARKET: GEOGRAPHIC GROWTH OPPORTUNITIES
FIGURE 18 CHINA TO REGISTER THE HIGHEST GROWTH DURING THE FORECAST PERIOD
5 MARKET OVERVIEW
5.1 INTRODUCTION
5.2 MARKET DYNAMICS
5.2.4.1 Product discontinuation
5.2.4.2 The shortage of trained medical professionals
5.2.4.3 Availability of refurbished products
5.2.3.1 Emerging countries in the Asia Pacific market
5.2.2.1 High costs of medical cameras
5.2.1.2 The growing demand for endoscopic procedures
5.2.1.3 Technological advancements in medical cameras
5.2.1.4 Increasing investments in endoscopy and laparoscopy facilities
5.2.1.1 The increasing number of surgical procedures
FIGURE 19 MEDICAL CAMERAS MARKET: DRIVERS, RESTRAINTS, OPPORTUNITIES, AND CHALLENGES
5.2.1 DRIVERS
TABLE 1 NUMBER OF SURGICAL PROCEDURES PERFORMED IN THE UNITED STATES EVERY YEAR
5.2.2 RESTRAINTS
5.2.3 OPPORTUNITIES
5.2.4 CHALLENGES
5.3 COVID-19 IMPACT ANALYSIS
5.4 VALUE CHAIN ANALYSIS
FIGURE 20 MAJOR VALUE IS ADDED DURING THE MANUFACTURING AND ASSEMBLY PHASE
5.5 SUPPLY CHAIN ANALYSIS
FIGURE 21 DIRECT DISTRIBUTION-STRATEGY PREFERRED BY PROMINENT COMPANIES
5.6 ECOSYSTEM ANALYSIS OF THE MEDICAL CAMERAS MARKET.
FIGURE 22 ECOSYSTEM ANALYSIS OF THE MEDICAL CAMERAS MARKET
6 MEDICAL CAMERAS MARKET, BY TYPE
6.1 INTRODUCTION
TABLE 2 GLOBAL MEDICAL CAMERAS MARKET, BY TYPE, 2016-2019 (USD MILLION)
TABLE 3 GLOBAL MEDICAL CAMERAS MARKET, BY TYPE, 2020-2026 (USD MILLION)
6.2 ENDOSCOPY CAMERAS
6.2.1 RISING NUMBER OF ENDOSCOPIC PROCEDURES TO PROPEL THE MARKET GROWTH FOR ENDOSCOPY CAMERAS
TABLE 4 TYPES OF ENDOSCOPIC PROCEDURES
TABLE 5 NUMBER OF DIAGNOSTIC BRONCHOSCOPY PROCEDURES PERFORMED (WITH OR WITHOUT BIOPSY), BY COUNTRY, 2014-2018
TABLE 6 NUMBER OF COLONOSCOPY PROCEDURES PERFORMED (WITH OR WITHOUT BIOPSY), BY COUNTRY, 2014-2018
TABLE 7 NUMBER OF LAPAROSCOPIC COLECTOMY PROCEDURES PERFORMED, BY COUNTRY, 2014-2018
TABLE 8 NUMBER OF LAPAROSCOPIC APPENDECTOMY PROCEDURES PERFORMED, BY COUNTRY, 2014-2018
TABLE 9 NUMBER OF LAPAROSCOPIC CHOLECYSTECTOMY PROCEDURES PERFORMED, BY COUNTRY, 2014-2018
TABLE 10 NUMBER OF LAPAROSCOPIC INGUINAL HERNIA REPAIR PROCEDURES PERFORMED, BY COUNTRY, 2014-2018
TABLE 11 NUMBER OF LAPAROSCOPIC HYSTERECTOMY PROCEDURES PERFORMED, BY COUNTRY, 2014-2018
TABLE 12 ENDOSCOPY CAMERAS MARKET, BY REGION, 2016-2019 (USD MILLION)
TABLE 13 ENDOSCOPY CAMERAS MARKET, BY REGION, 2020-2026 (USD MILLION)
6.3 SURGICAL MICROSCOPY CAMERAS
6.3.1 INCREASING NUMBER OF SURGICAL PROCEDURES AND TECHNOLOGICAL ADVANCEMENTS TO SUPPORT MARKET GROWTH
TABLE 14 SURGICAL MICROSCOPY CAMERAS MARKET, BY REGION, 2016-2019 (USD MILLION)
TABLE 15 SURGICAL MICROSCOPY CAMERAS MARKET, BY REGION, 2020-2026 (USD MILLION)
6.4 OPHTHALMOLOGY CAMERAS
6.4.1 RISING PREVALENCE OF EYE DISEASES TO SUPPORT THE GROWTH OF THE OPHTHALMOLOGY CAMERAS MARKET
TABLE 16 NUMBER OF GLAUCOMA PATIENTS, BY COUNTRY AND TYPE, 2013 VS. 2020 VS. 2040 (MILLION)
TABLE 17 POPULATION WITH OCULAR CONDITIONS IN THE US, 2000 VS. 2010 VS. 2020 (MILLION INDIVIDUALS)
TABLE 18 PROJECTED DISABILITY-ADJUSTED LIFE YEARS ACROSS VARIOUS REGIONS, BY DISEASE, 2015 VS. 2030 (MILLION YEARS)
TABLE 19 OPHTHALMOLOGY CAMERAS MARKET, BY REGION, 2016-2019 (USD MILLION)
TABLE 20 OPHTHALMOLOGY CAMERAS MARKET, BY REGION, 2020-2026 (USD MILLION)
6.5 DERMATOLOGY CAMERAS
6.5.1 RISING NUMBER OF DERMATOLOGICAL PROCEDURES TO BOOST THE DERMATOLOGY CAMERAS MARKET
TABLE 21 NUMBER OF SURGICAL PROCEDURES PERFORMED BY PLASTIC SURGEONS GLOBALLY, 2015 VS. 2018 VS. 2019
TABLE 22 NUMBER OF NON-SURGICAL PROCEDURES PERFORMED GLOBALLY BY PLASTIC SURGEONS, 2015 VS. 2018 VS. 2019
TABLE 23 DERMATOLOGY CAMERAS MARKET, BY REGION, 2016-2019 (USD MILLION)
TABLE 24 DERMATOLOGY CAMERAS MARKET, BY REGION, 2020-2026 (USD MILLION)
6.6 DENTAL CAMERAS
6.6.1 INCREASING INCIDENCE OF ORAL DISEASES TO SUPPORT THE DENTAL CAMERAS MARKET GROWTH
TABLE 25 DENTAL CAMERAS MARKET, BY REGION, 2016-2019 (USD MILLION)
TABLE 26 DENTAL CAMERAS MARKET, BY REGION, 2020-2026 (USD MILLION)
6.7 OTHER MEDICAL CAMERAS
TABLE 27 OTHER MEDICAL CAMERAS MARKET, BY REGION, 2016-2019 (USD MILLION)
TABLE 28 OTHER MEDICAL CAMERAS MARKET, BY REGION, 2020-2026 (USD MILLION)
7 MEDICAL CAMERAS MARKET, BY SENSOR
7.1 INTRODUCTION
TABLE 29 CMOS SENSORS VS. CCD SENSORS IN MEDICAL CAMERAS
TABLE 30 MEDICAL CAMERAS MARKET, BY SENSOR, 2016-2019 (USD MILLION)
TABLE 31 MEDICAL CAMERAS MARKET, BY SENSOR, 2020-2026 (USD MILLION)
7.2 CMOS SENSORS
7.2.1 CMOS SENSORS TO LEAD THE MEDICAL CAMERAS MARKET DURING THE FORECAST PERIOD
TABLE 32 CMOS SENSOR-BASED MEDICAL CAMERAS MARKET, BY REGION, 2016-2019 (USD MILLION)
TABLE 33 CMOS SENSOR-BASED MEDICAL CAMERAS MARKET, BY REGION, 2020-2026 (USD MILLION)
7.3 CCD SENSORS
7.3.1 DISCONTINUATION OF CCD SENSORS BY PLAYERS IN THE MARKET CAN HAMPER THE MARKET GROWTH
TABLE 34 CCD SENSOR-BASED MEDICAL CAMERAS MARKET, BY REGION, 2016-2019 (USD MILLION)
TABLE 35 CCD SENSOR-BASED MEDICAL CAMERAS MARKET, BY REGION, 2020-2026 (USD MILLION)
8 MEDICAL CAMERAS MARKET, BY RESOLUTION
8.1 INTRODUCTION
TABLE 36 MEDICAL CAMERAS MARKET, BY RESOLUTION, 2016-2019 (USD MILLION)
TABLE 37 MEDICAL CAMERAS MARKET, BY RESOLUTION, 2020-2026 (USD MILLION)
8.2 HIGH-DEFINITION CAMERAS
8.2.1 TECHNOLOGICAL ADVANCEMENTS IN HIGH-DEFINITION CAMERAS TO SUPPORT MARKET GROWTH
TABLE 38 HIGH-DEFINITION MEDICAL CAMERAS MARKET, BY REGION, 2016-2019 (USD MILLION)
TABLE 39 HIGH-DEFINITION MEDICAL CAMERAS MARKET, BY REGION, 2020-2026 (USD MILLION)
8.3 STANDARD-DEFINITION CAMERAS
8.3.1 STANDARD-DEFINITION CAMERAS MAY BECOME OBSOLETE DUE TO THE AVAILABILITY OF BETTER-RESOLUTION CAMERAS IN THE MARKET
TABLE 40 STANDARD-DEFINITION MEDICAL CAMERAS MARKET, BY REGION, 2016-2019 (USD MILLION)
TABLE 41 STANDARD-DEFINITION MEDICAL CAMERAS MARKET, BY REGION, 2020-2026 (USD MILLION)